Introduction
The goal of this project was simple - create a visualization to display the current position of the ISS in real-time. This was my first major attempt to create a display to be used on my new 64x32 RGB matrix from Adafruit.
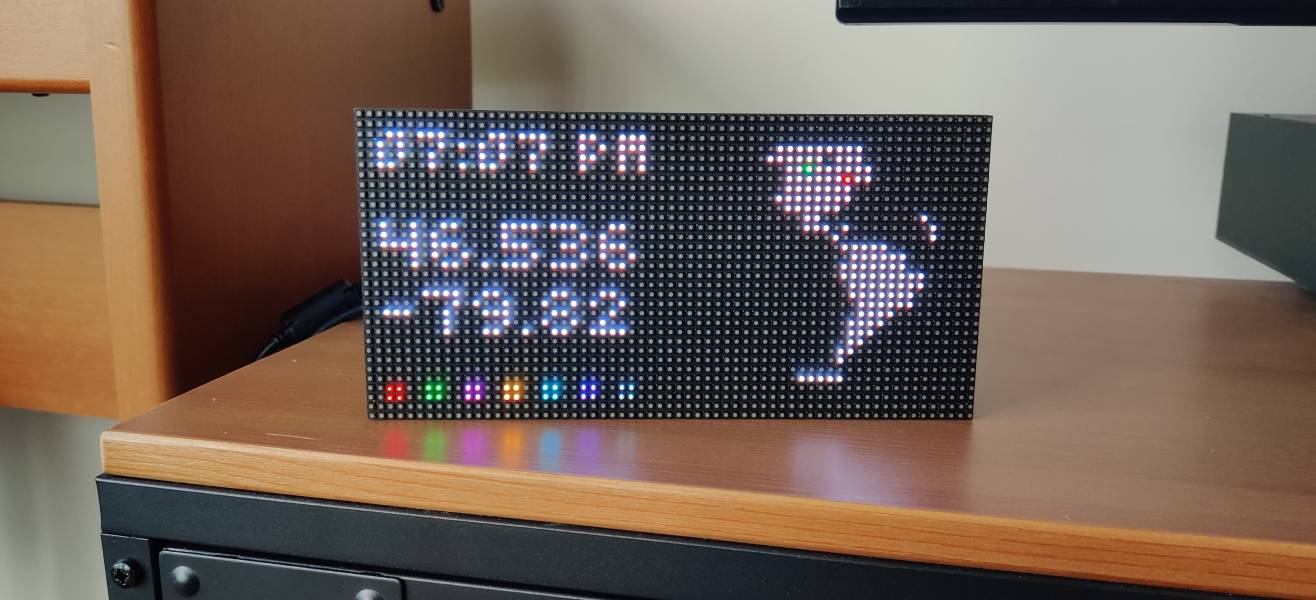
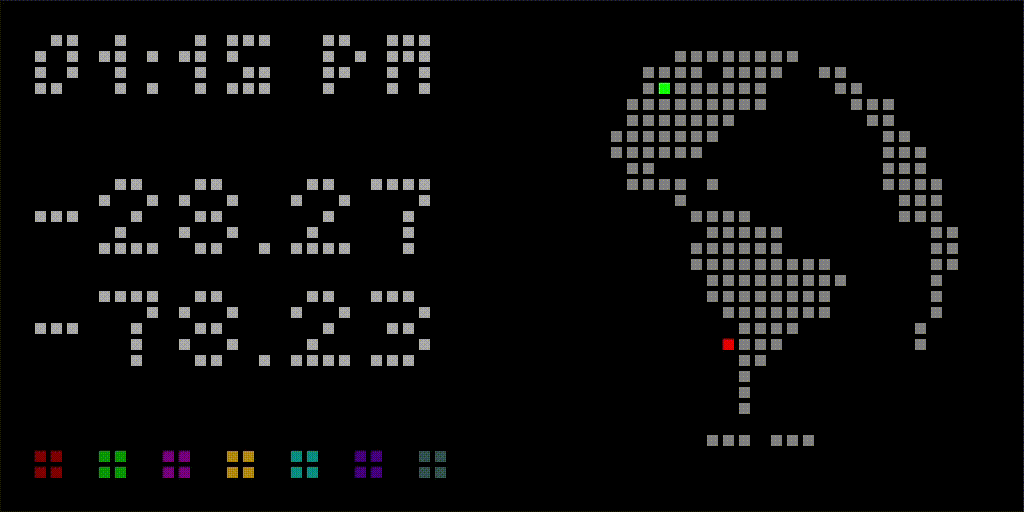
The red dot on the image above represents the ISS and the green dot shows my current location. Displayed on the left there is time, ISS latitude, ISS longitude, and the number of astronauts on board (one coloured square for each).
The source code for this project can be found here.
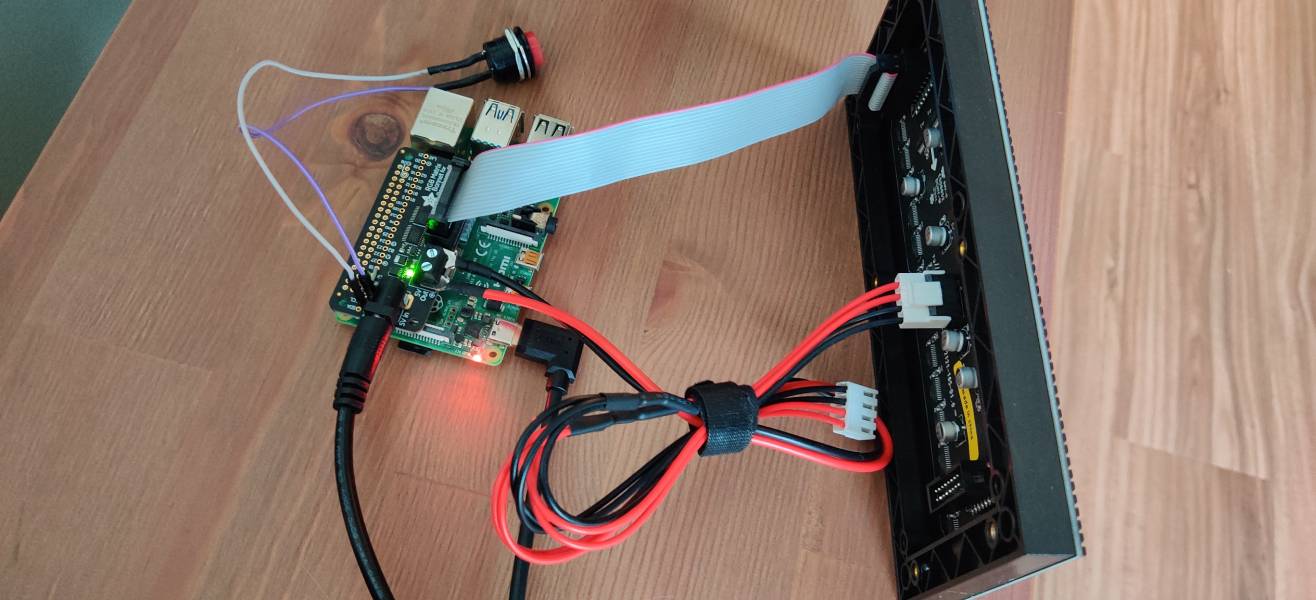
Parts
The following are the parts that I used to build this project. Most of them were purchased from Adafruit.
- 64x32 RGB LED Matrix - 3mm pitch
- Adafruit RGB Matrix Bonnet for Raspberry Pi
- 5V 10A switching power supply
- SD/MicroSD Memory Card (8 GB SDHC)
- Raspberry Pi 4 Model B
- Official Raspberry Pi Power Supply 5.1V 3A with USB C
The Spinning Globe
To get this to work, I needed to brush up on my linear algebra skills. I used this video as a starting point for my code. It explains how to convert from a spherical coordinate system to a Cartesian coordinate system, initialize a numpy matrix to store the coordinates for the sphere, and how to apply a rotation matrix. The video describes how to use this to draw an ASCII Earth with pygame, but I managed to adapt it to work with the RGB matrix.
Generating the nodes
First, for each latitude (north/south) I iterated over a number of longitudes (east/west) and converted the latitude/longitude pair to a xyz coordinate. These coordinates were then converted to a numpy matrix. The add_nodes() and convert_coords() methods were written to achieve this.
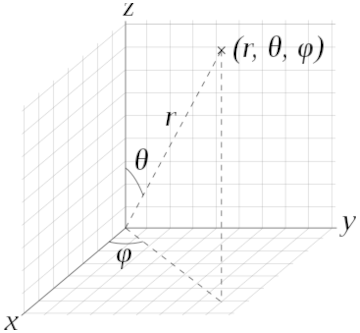
Converting from spherical to Cartesian coordinates is done using the following equations:
When given standard latitude and longitude values as input, is the complement of the latitude, or co-latitude, and is the complement of the longitude. is the radius of the sphere. The following image from the Wikipedia article helps illustrate this.
Note
I switched the equations for y and z to allow y to represent the vertical axis.
Here is the code the implements this:
def convert_coords(self, lat, lon):
"""
Converts latitude and longitude to Cartesian coordinates.
In this case the y coordinate is on the vertical plane
and x and z are on the horizontal plane.
"""
x = round(self.RADIUS * sin(lat) * cos(lon), 2)
y = round(self.RADIUS * cos(lat), 2)
z = round(self.RADIUS * sin(lat) * sin(lon), 2)
return (x, y, z)
def add_nodes(self):
"""
Generates the nodes used to display the Earth and stores them in an array.
Backups of the arrays are saved so they can be restored on each rotation.
"""
xyz = []
# Map to Cartesian plane.
for i in range(self.MAP_HEIGHT + 1):
lat = (pi / self.MAP_HEIGHT) * i
for j in range(self.MAP_WIDTH + 1):
lon = (2 * pi / self.MAP_WIDTH) * j
xyz.append(self.convert_coords(lat, lon))
# Build the array of nodes.
node_array = np.array(xyz)
ones_column = np.ones((len(node_array), 1))
ones_added = np.hstack((node_array, ones_column))
self._earth_nodes = np.vstack((self._earth_nodes, ones_added))
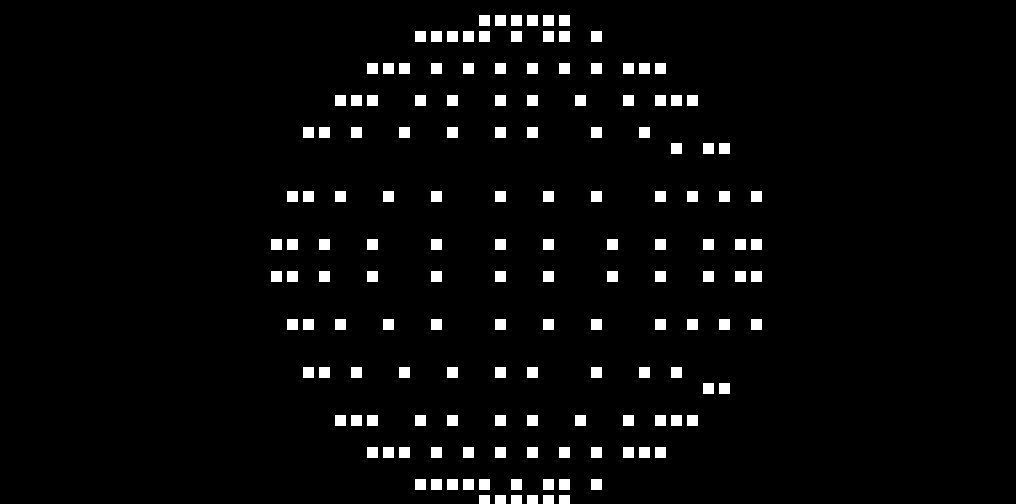
...Drawing the nodes
Once the nodes have been initialized they can be drawn to the screen. Drawing is done using the PIL library. On each frame, a 64x32 PIL image is created and sent to the RGB matrix to be drawn. To create the frame, each node is iterated over and the pixel at the x and y coordinate is drawn (only if z > 1 to only draw nodes in the foreground).
def draw(self, image):
"""
Draws the Earth, ISS, and home node arrays to the display.
"""
# Draw the Earth.
for i, node in enumerate(self._earth_nodes):
if (i > self.MAP_WIDTH - 1 and
i < (self.MAP_WIDTH * self.MAP_HEIGHT - self.MAP_WIDTH) and
node[2] > 1):
image.putpixel(
(self.X + int(node[0]),
self.Y + int(node[1]) * -1),
self.EARTH_COLOR
)
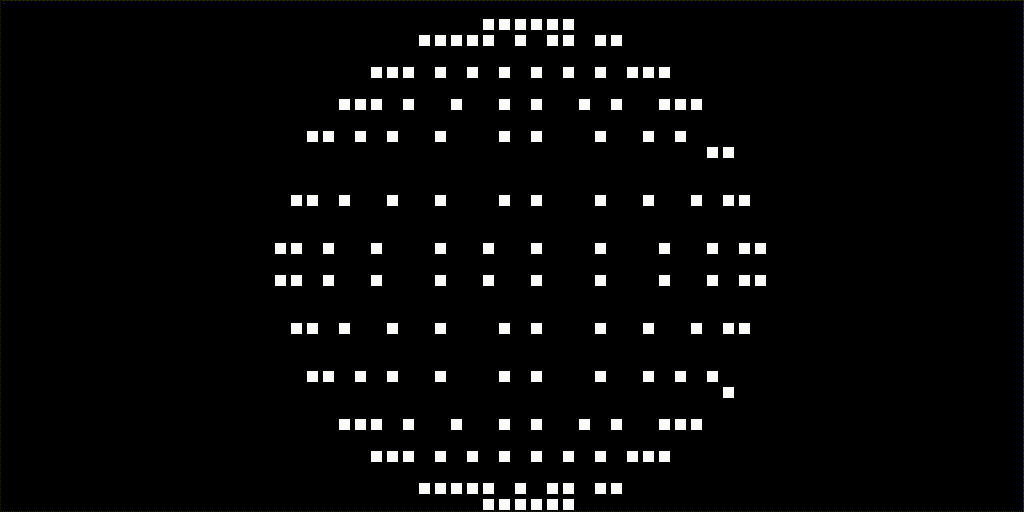
...This is what the result looks like before a bitmap of the Earth is applied. The resolution can easily be increased by changing the MAP_WIDTH and MAP_HEIGHT variables before the nodes get created. The resolution below is lower than what is used in the final result. The higher the resolution the more computations are needed when rotating and drawing the sphere.
Making it spin
Making the sphere spin is relatively easy with a little more linear algebra. On every frame, before it gets drawn, all we have to do is apply a rotation matrix to the node array that rotates each node by some angle . This can be done with the matmul() function provided by numpy. The matrix used in the code will spin the nodes around the vertical axis.
def update_spin(self):
    """
    Handles the logic to control the Earth rotation.
    Resets the nodes to the backed-up version after every full rotation.
    """

    ...

    c = np.cos(self.SPIN_THETA)
    s = np.sin(self.SPIN_THETA)

    matrix_y = np.array([
        [c, 0, s, 0],
        [0, 1, 0, 0],
        [-s, 0, c, 0],
        [0, 0, 0, 1]
    ])

    self.rotate(matrix_y)

def find_center(self):
    """
    Returns the center coordinates of the Earth.
    """
    return self._earth_nodes.mean(axis=0)

def rotate(self, matrix):
    """
    Applies the rotation matrix to the Earth array, ISS array, and home array.
    """
    center = self.find_center()

    for i, node in enumerate(self._earth_nodes):
        self._earth_nodes[i] = center + np.matmul(matrix, node - center)

    ...
This will produce the following result:
Adding the Earth bitmap
To actually make the sphere look like the Earth I took a black and white image of the Earth and reduced its size to MAP_WIDTH by MAP_HEIGHT. I then converted the image to an array of bits, 1 for a white pixel and 0 for a black pixel. When drawing the Earth I then check the array at the index for the corresponding node and only draw the pixel if the bit is 1. The following image is converted with the code below:

def convert_map(self):
    """
    Converts the PNG image of the world map to one that can be projected onto the sphere.
    Turns the pixels in an array of bits.
    """
    # Open the map image.
    path = os.path.join(SRC_BASE, "assets", "issview", "world-map.png")
    img = Image.open(path).convert("1")

    # Transform the image to fit sphere dimensions.
    resized = img.resize((self.MAP_WIDTH + 1, self.MAP_HEIGHT + 1), Image.BOX)
    flipped = ImageOps.mirror(resized)
    shifted = ImageChops.offset(flipped, self.MAP_CALIBRATION, 0)

    # Convert to bit array.
    for y in range(shifted.height):
        for x in range(shifted.width):
            pixel = shifted.getpixel((x, y))
            self._map.append(int(pixel == 255))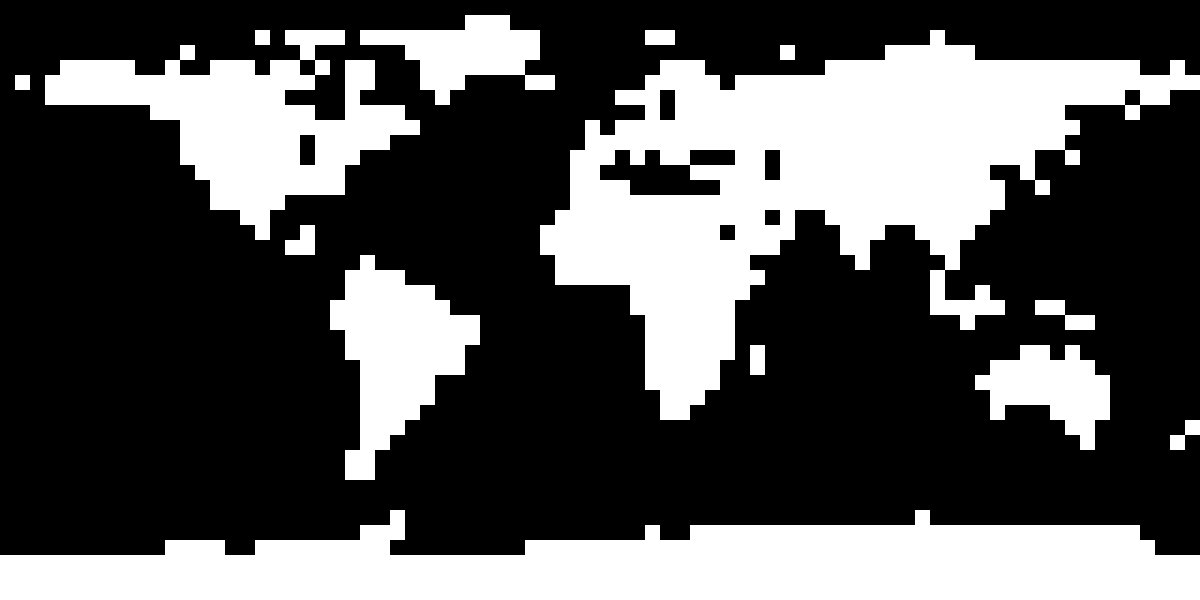
Drawing the ISS
Drawing the ISS on the sphere is very similar to drawing the nodes for the Earth. Every 5 seconds I’m sending a request to an API which returns the current latitude and longitude for the ISS. I take this information and generate a node matrix with a single node for the ISS. The rotation matrix is applied to this new ISS matrix as well. Then when drawing the frame, I change the pixel for where the ISS is to red.
I do the same process to draw the green dot for my location.
def update_iss(self):
    """
    Generates a new array of nodes to store the location of the ISS.
    """
    self.update_coords()

    ones_column = np.ones((1, 1))
    ones_added = np.hstack(([self._iss_coords], ones_column))
    self._iss_nodes = np.vstack((np.zeros((0, 4)), ones_added))

def draw(self, image):
    """
    Draws the Earth, ISS, and home node arrays to the display.
    """

    ...

    # Draw the ISS.
    iss_x = int(self._iss_nodes[0][0])
    iss_y = int(self._iss_nodes[0][1])
    iss_z = self._iss_nodes[0][2]

    if iss_z > 1:
        image.putpixel((self.X + iss_x, self.Y + iss_y * -1), self.ISS_COLOR)

    # Draw home.
    home_x = int(self._home_nodes[0][0])
    home_y = int(self._home_nodes[0][1])
    home_z = self._home_nodes[0][2]

    if home_z > 1:
        image.putpixel((self.X + home_x, self.Y + home_y * -1), self.HOME_COLOR)
Final result
A video of the final ISS tracking display running on the RGB matrix can be found here.
This was a really fun project that forced me to brush up on my linear algebra. It is a cool visualization to leave running in the background.